Reports & performance
Data
Periodic updates on model performance, backtests, and notable findings. Checked in by hand, so expect rough edges — this is the lab notebook, not a polished dashboard.
World Cup - Wrapup Report
World Cup 2026 is a wrap and its time to look back at how the data model and analytics we built for the tournament performed. Before getting into results, here's a little more info on what was built.
The What:
The World Cup model was built on top of an existing database and analytics/marketing tools used to make picks for the Italian Serie A football league. The database tracks results and odds per team (odds are single sourced), with tools to automate the calculation of expected value (EV) for common markets:
1x2 (i.e. win/lose/draw)
over / under goals (supporting full, half and quarter totals)
These tools were built in python from the ground up, heavily leveraging AI coding assistants starting with Github Copilot before moving to Claude Code. As the World Cup advanced, support for alternate picking modes, to be used when positive EV was not found, were added so the system would always generate a pick per match. The pick per match requirement was intentional to provide opportunities to learn from real picks on real events. Scoring (calculating win/loss and ROI) on a daily basis was also done every day and posted on our X and BlueSky accounts for full transparency on performance.
The first commit for world cup specific support was made on 6-10, so everything came in rather hot!
The Results:
The top-line results are
win/loss: 51 wins, 48 losses, 5 pushes (104 picks)
roi: +4.3%
As a trend over time, the graph below shows trends and daily results on ROI. 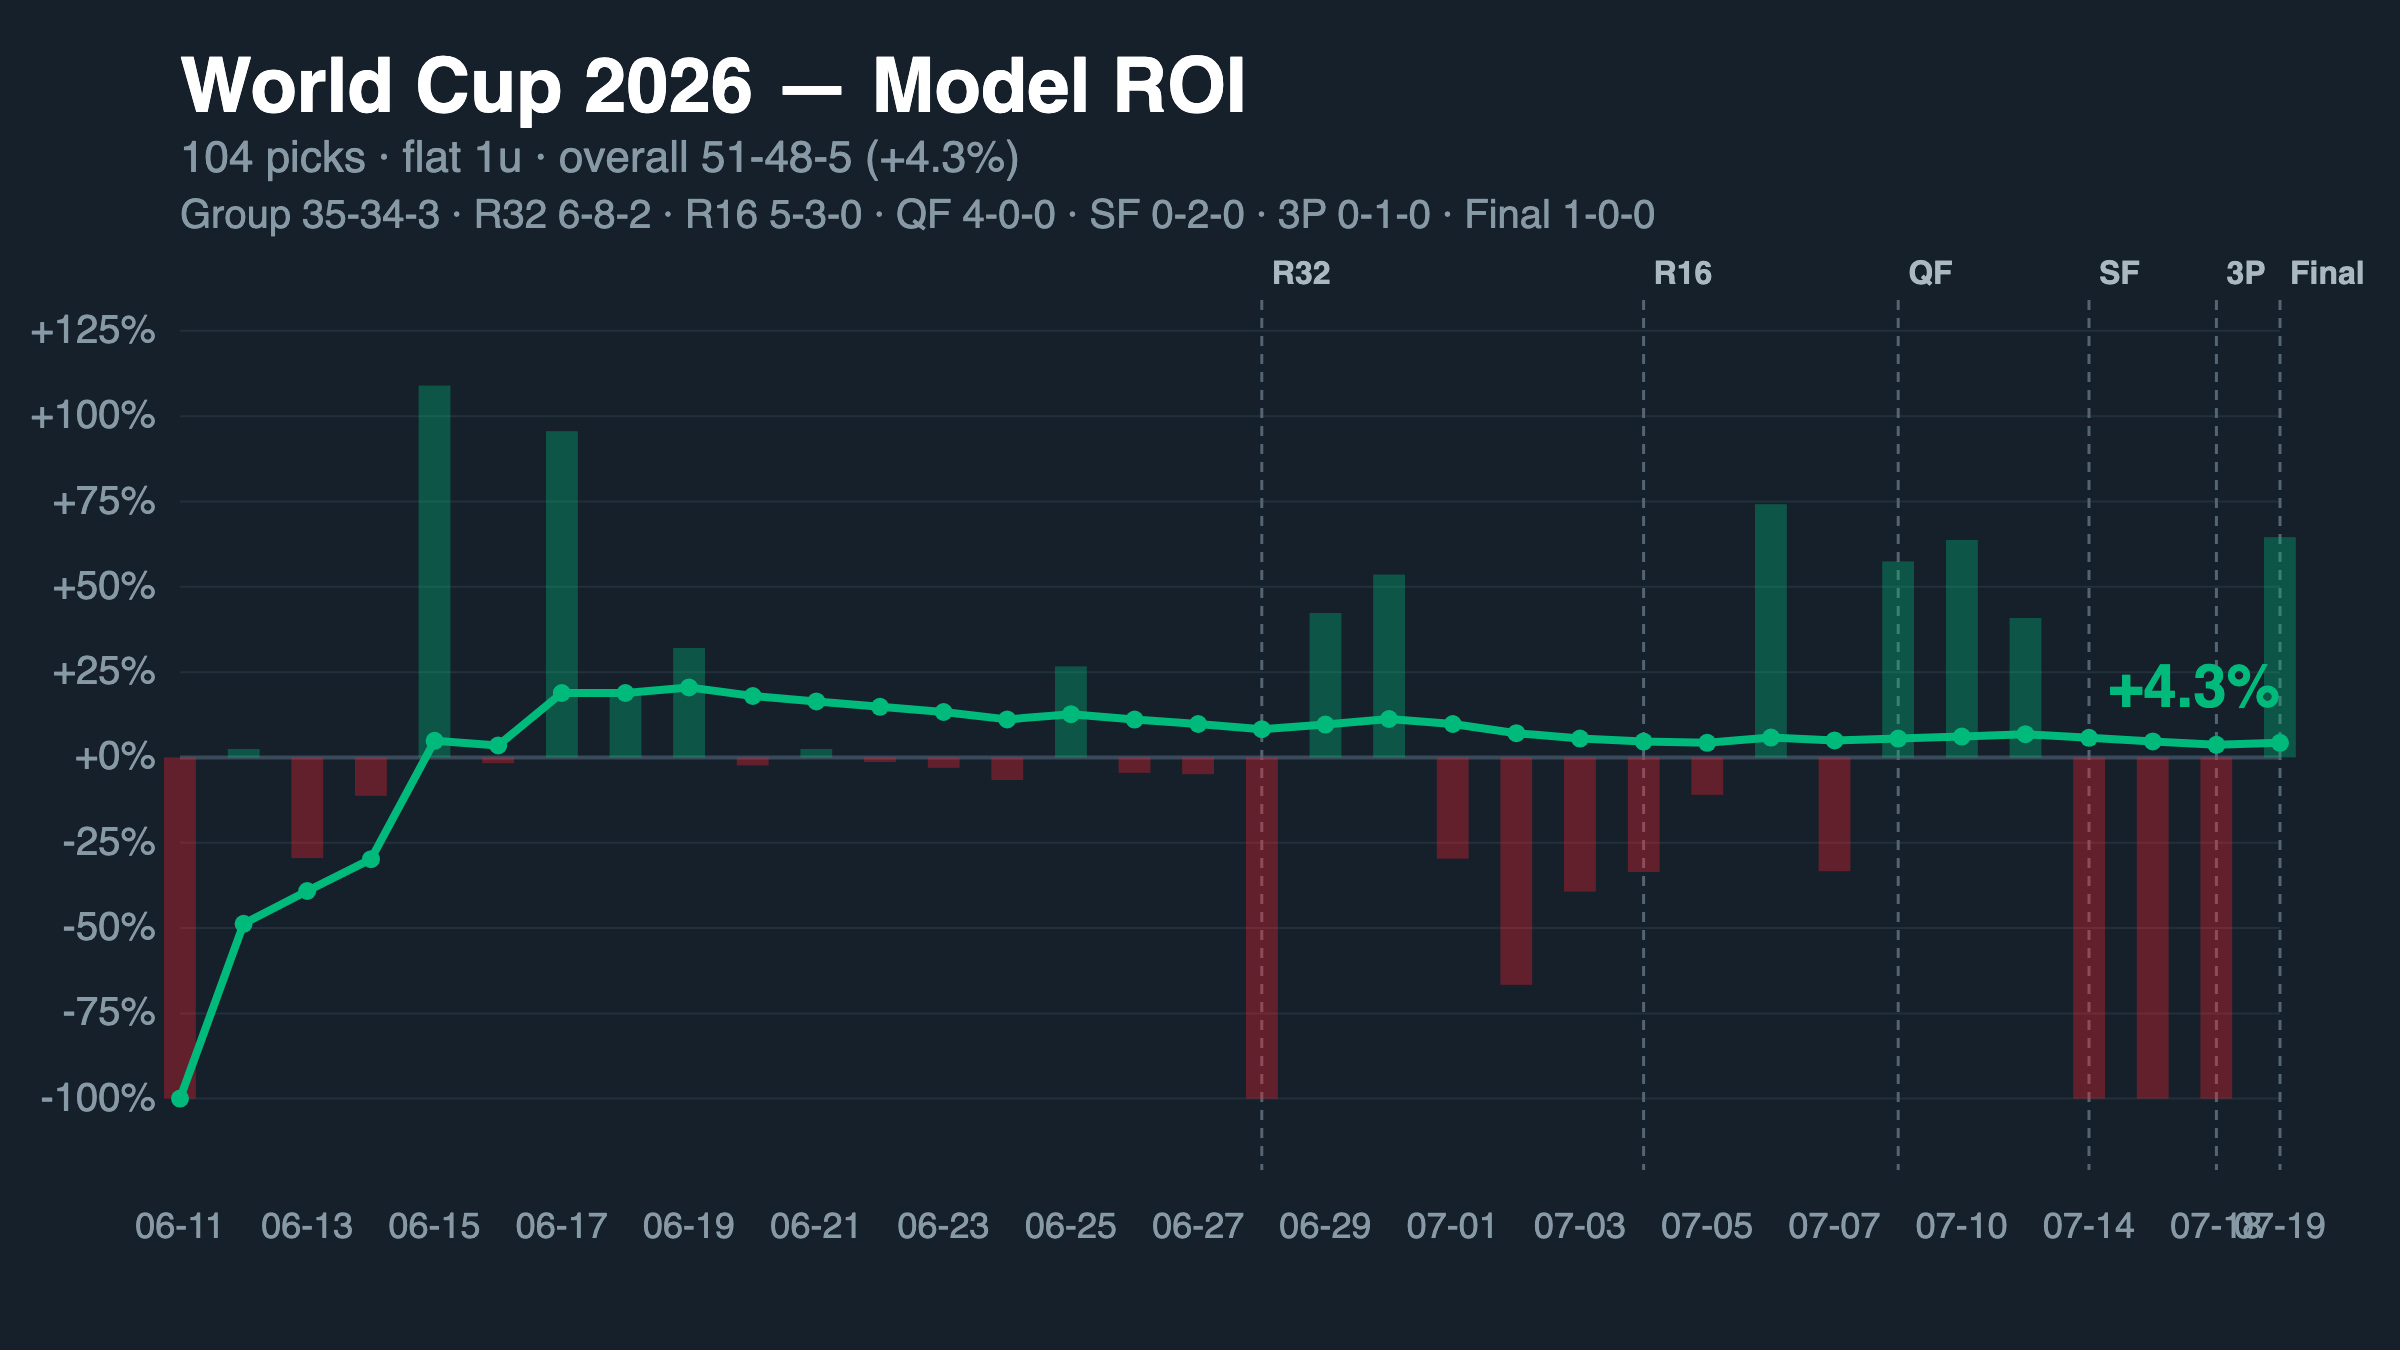 The model's best days returned over 100% ROI, while the worst days...well lost everything. Breaking down picks by market (i.e. 1x2, over/under or to advance) the model had the following performance:
1x2 picks performed the worst - 8-18-0 overall with -13.1% ROI
over/under picks performed the best - 36-25-5 overall with +13.3% ROI
On a per-team basis, here's the teams the model did the best at and the worst at (min of 5 picks)
Top 3 by ROI:
Paraguay — 3-2-0 (5 picks), +53.0% ROI
Brazil — 3-1-1 (5 picks), +36.0% ROI
Belgium — 4-2-0 (6 picks), +25.4% ROI
Bottom 3 by ROI:
Egypt — 1-4-0 (5 picks), -73.3% ROI
Switzerland — 2-4-0 (6 picks), -48.0% ROI
Canada — 2-3-0 (5 picks), -34.4% ROI
Belgium was a tough team to model initially as their top scorer (Lukaku) had played limited minutes for his club team which made it challenging to model Belgiums attack. To manage this, Belgium was pinned to their FIFA ranking rather than the standard method the model used for other teams, which weighted club performance on a per player basis to develop a national team attack and defense metric for each of the 48 teams in the World Cup. This was a good example of learning and adapting as the World Cup progressed.
Final 4 by ROI:
For the teams that made the semifinals, the model had the following performance per team
Spain - 4-3-1 (8 picks), -4.7% ROI
Argentina - 6-2-0 (8 picks), +25% ROI
England - 5-3-0 (8 picks), +14.8% ROI
France - 5-3-0 (8 picks), +16.1% ROI
Below are some interactive elements that show how the model performed on both a per-market basis across rounds, and how the model performed on its variance from the books implied probabilities. Variance from sports book implied probabilities wasn't a reliability signal — and the biggest disagreements were mostly an early-tournament artifact, not a recurring feature of the finished model.
World Cup pick selection improvement
We built our World Cup model around a basic premise - find the betting opportunity for each match that had the most value. Value is defined as the most edge (Expected Value) between our models computed probability of an event happening (for example, USA / Paraguay game to have over 2 goals), and the implied probability from the odds the sports book provides. The larger the Expected Value (EV) the better the value.
For most of this World Cup, the model's pick-selection logic was simple: take whichever side had the best Expected Value. That worked well most of the time, but it had a blind spot — it trusted its own probability estimate equally whether the model was genuinely confident (70%+) or barely more sure than a coin flip (50-55%). On several matches, that meant the "best EV" pick was sometimes really a low probability event that had high value or a near-coinflip probability estimate that happened to produce a positive number once run through the sports books pricing.
One of the investments we’ve made recently is to improve the actual selection logic for picks. This has been implemented on top of the v13 data model (i.e. no changes to weights, underlying metrics that we have per player or team). The new selection process has two steps (v. The one “take the best EV” that we had before)
- Step one ("value mode") only trusts the model's own ranking when it's actually confident — probability at or above some threshold (starting at 60% before tuning) — and only takes that pick if the resulting expected value is positive.
- Step two ("prediction mode") only fires when step one comes up empty: rather than force a low-confidence model opinion onto the board, the system explicitly stops trusting its own ranking and defers to whichever side the betting market itself is most confident about, taking the best price among the market's real favorites.
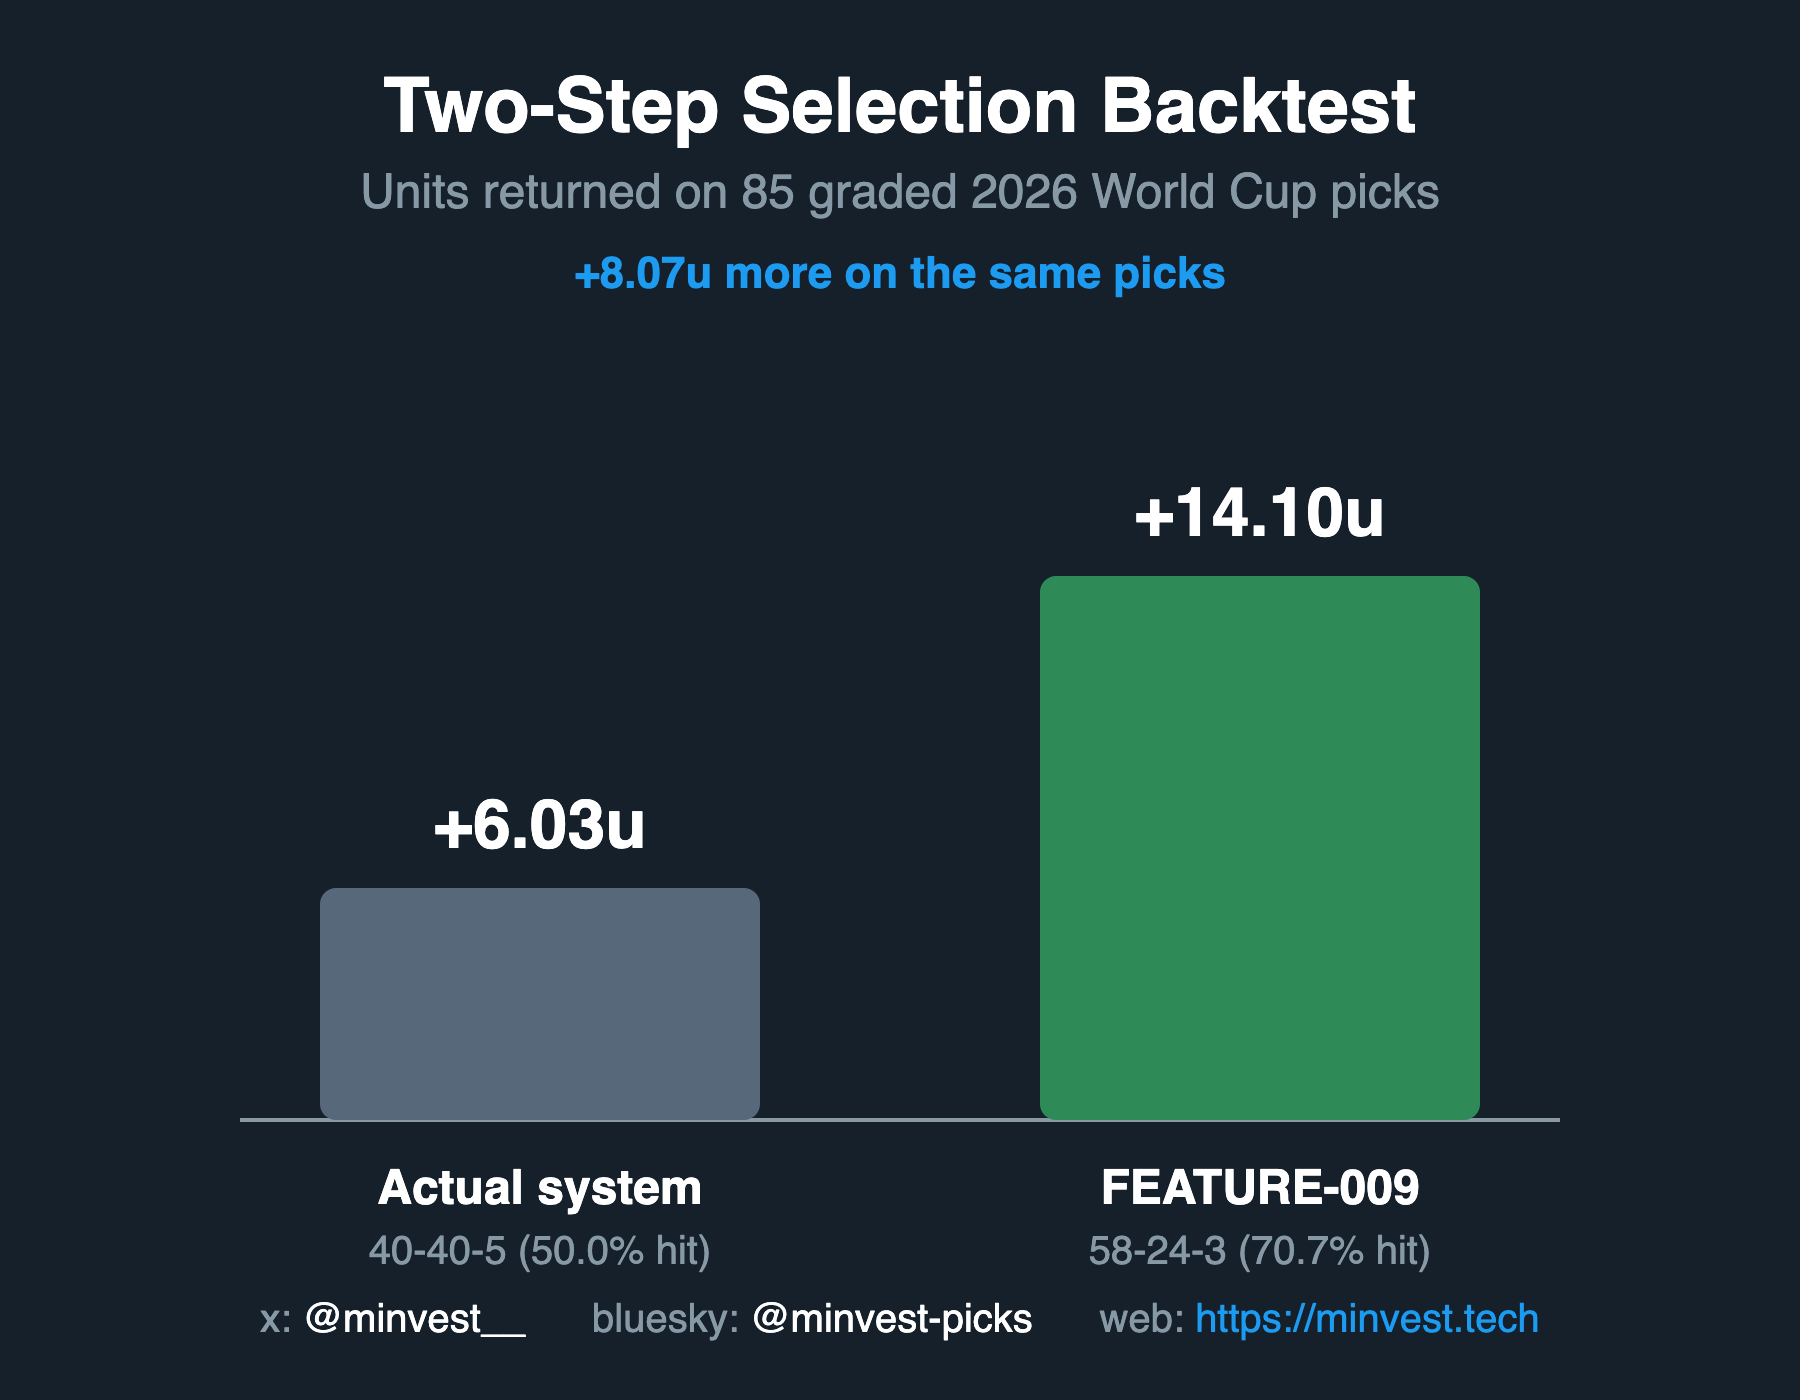
Before shipping it, we backtested the two-step logic against all 85 picks graded so far this tournament. The new process would have returned +14.10 units against the actual system's +6.03 units on those same 85 games — roughly double — with a 70.7% hit rate, and the edge held up independently in both the group stage and the round of 32, not just in one lucky bucket.
World Cup 2026 - Model Performance (Group Stage)
Group stage complete. The model posted one pre-match value pick for all 72 matches and finished 35-34-3 for +7.04 units, a +9.8% ROI (flat 1u stake per pick). We started group stage with a brand new model that leveraged some the foundational pieces that we built for Serie A last year and quickly iterated on it as the tournament progressed. The most notable improvements in Group stage were the additions of floors/guards around extreme EV outcomes that also had extremely low probabilities of occuring (i.e. heaving underdogs that the market undervalued). Below are some charts to give a first glance into ROI by areas/markets.
ROI by confidence
High confidence performed best; medium confidence was the weakest segment.
ROI by market
Totals were the strongest area; match-result bets were the main struggle.
Minvest improves while the AI agents plateau
Minvest opened the 2026 World Cup rough — just 14% accuracy across the first three days. By days 7–9, that climbed to 69%, the best of any system tracked. ChatGPT showed the inverse: a hot 86% start that faded to 38% as the tournament evolved. The model learns. The others don’t.
Days 7–9
Day 1 to Day 9
most recent phase